- A waveform records the AE signal over time, showing its arrival time, strength and decay.
- FFT decomposes the waveform into frequency components, revealing differences between sources that are hard to see in the waveform alone.
- Tracking energy changes in specific bands against the normal-state spectrum enables early detection of equipment anomalies.
AE signals are recorded as waveforms over time, and splitting the same signal into frequency components reveals characteristics that the waveform alone does not show. This article explains how to read AE waveforms, how FFT analysis works and how it is used for equipment diagnosis.
What is an AE waveform?
A waveform records the magnitude of the signal detected by the sensor in time order. An AE system stores the waveform for a set interval before and after the moment the signal crosses the threshold, showing when the signal arrived, how strong it was and how it faded.
What a waveform tells you
- Arrival time: When the signal first appears. Differences in arrival time at several sensors are used to locate the source.
- Rise: How quickly the signal reaches its peak amplitude. Used to identify source types and discriminate noise.
- Decay: How quickly the signal fades. Depends on material, propagation distance and source characteristics.
- Signal type: Distinguishes short, strong burst signals from uninterrupted continuous signals.
Hit-based parameters (amplitude, counts, energy, etc.) summarize the waveform in a few numbers. Because information is lost in that summary, the waveform itself or its frequency content is analyzed as well when sources must be distinguished precisely.
What is FFT?
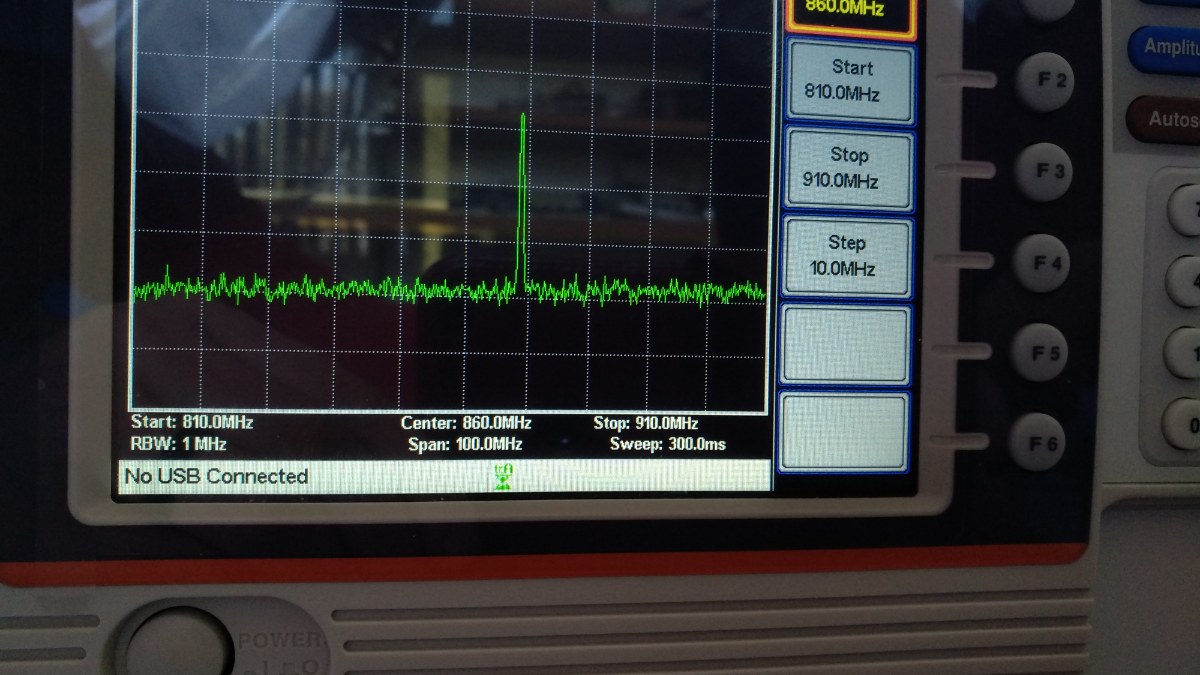
FFT (Fast Fourier Transform) is a calculation that decomposes a time-domain signal into a sum of frequency components. The result is shown as a spectrum of signal magnitude by frequency. In the waveform, components overlap, but in the spectrum you can immediately see which frequency bands the energy is concentrated in.
Settings to check in FFT analysis
| Item | Meaning | Considerations |
|---|---|---|
| Sampling frequency | Number of measurements per second | Must be at least twice the highest frequency of interest (Nyquist criterion); for AE it is usually set well above that. |
| Data length | Number of samples per FFT | Longer data improves frequency resolution (sampling frequency ÷ number of samples), but for short burst signals the share of noise can increase. |
| Window function | Function that tapers both ends of the segment | Applying a window such as Hanning reduces spectral leakage caused by cutting the segment. |
| Averaging | Averaging spectra from several segments | Reduces variation when obtaining a representative spectrum of continuous signals or background noise. |
What can a spectrum distinguish?
Each source distributes its energy over different frequency bands, so the spectrum offers clues for distinguishing sources. The following are general tendencies; actual values depend on material, structure and sensor characteristics.
| Source | Spectral tendency |
|---|---|
| Crack growth | Short burst signals, often with high-frequency components over a relatively wide band. |
| Friction · wear | Continuous signals, with energy tending to concentrate in relatively lower bands. |
| Leak | Appears as persistently elevated energy in a specific band. |
| Machine · flow noise | Mostly concentrated at low frequencies and easy to separate with a band-pass filter. |
| Electrical noise | Often appears as narrow, sharp peaks at specific frequencies. |
Because resonant AE sensors are highly sensitive at a specific frequency, the sensor’s resonant frequency is strongly reflected in the spectrum. Rather than directly comparing spectra obtained with different sensors or settings, it is more accurate to compare against the normal state measured with the same sensor and settings.
How is it used for equipment diagnosis?
In the field, changes over time matter more than a single spectrum. The spectrum during normal operation is saved as a baseline, and later measurements are compared with it to find what has changed.
- Band energy trend: Track the total energy in frequency bands of interest over time.
- Peak and centroid shifts: Check whether the frequency of the largest component or the spectral centroid moves.
- Deviation from the baseline spectrum: Turn the difference from the normal state into an index and send an alert when it exceeds a threshold.
- Input for AI analysis: Spectral features such as band energy and peak frequency are used as inputs to anomaly detection models.
Use STFT for signals that change over time
Because FFT shows the entire selected segment as a single spectrum, changes in frequency content over time are not visible. In that case, an STFT (short-time Fourier transform), which repeats the FFT over short segments, is used to build a time–frequency map (spectrogram) for analysis.
Need help analyzing AE data?
Rina Solution provides a monitoring solution that covers waveform acquisition, frequency analysis, anomaly decisions and alerts.
Contact usView use cases